
A reference page for the article template: every element old blog posts use (copied from real posts where it matters) and every element added for the redesign, in one place. Body text with bold, italic, a link and a footnote mark1.
A centred paragraph, as some old posts use.
A paragraph in the Large font size.
A paragraph with a text colour, from an old post:
Original: The Covid Class Part 4: This Cycle’s Deposits · live
Want to discuss any of these trends in further detail or get a sneak peek at how your institution compares to national trends or your peers’ performance?
Headings
Heading 1 (avoid in posts: the title is the H1)
Heading 2
Text under a heading 2.
Heading 3
Text under a heading 3, the most common heading in old posts.
Heading 4
Text under a heading 4.
Heading 5
Text under a heading 5.
Heading 6
Text under a heading 6 (a small label).
Lists
- A bulleted list item.
- A second item with bold text.
- A third item.
- A numbered list item.
- A second numbered item.
- A third numbered item.
- A ticks list item (block style Ticks).
- A second ticks item.
Quotes
Quote with the name typed after a line break (most old posts):
Original: Quinnipiac’s Karissa Peckham on Increasing Yield Rates More Efficiently · live
“MARKETview Applicant Score, along with visit activity, are really helpful in determining the right students to admit.”
– Karissa Peckham
Quote with a citation:
Original: Deliberate Acts Create Results: How Western New England University Succeeds by Leveraging Key Behavior Metrics in MARKETview · live
“MARKETview provides proof points for why we can stop doing things that aren’t working and what we can focus on instead.”
Greg Matthews, VPEM, Western New England University
Quote with a white background, from an old post:
Original: The Proactive Enrollment Leader: Three Key Insights From Our Expert Panel · live
“What insights can we get from MARKETview to adapt?”
-Lauren Jensen
Pull quote (new design):
AI is the mechanism. The data underneath is the advantage.
Ben Plache, MARKETview
Separator
Text above a separator.
Text below a separator.
Images


Style “Square” (Styles panel), for images with a square frame of their own; rounded is the default:

Media & text
With a background colour, from an old post:
Original: Enrollment Tips From Sun Tzu (and Other Luminaries) · live
MARKETview’s proprietary data platform delivers customized insights that can’t be accessed anywhere else, giving our partners an advantage in accomplishing enrollment, revenue and retention objectives.

With a green background, from an old post:
Original: What We Know About the Behavior of Application Starters · live
Interested in learning how MARKETview can help you reach your goals?

The same in the style “Square” (image and box):
Original: What We Know About the Behavior of Application Starters · live
Interested in learning how MARKETview can help you reach your goals?
Text vertically centred beside the image, from an old post:
Original: A Closer Look at Email Deliverability Challenges in Higher Ed · live

Two Ocean’s technical team has deep expertise in domain health, actively monitoring scores on a daily basis and implementing immediate, cutting-edge remediation strategies if a score drops to give partners the best chance of successfully reaching inboxes.
With a wide image (75% in the editor, capped at 60%), from an old post:
Original: 5 Key Quotes from Our Presidential Panel · live

Learn how the presidents from two institutions are addressing and overcoming a variety of disrupting factors across higher education.
With a small icon (21%), from an old post:
Original: Enrollment Tips From Sun Tzu (and Other Luminaries) · live

Jeff Jamison is Director, Corporate Content at MARKETview and has been supporting higher ed institutions for more than a quarter century. Please know that within this blog, any resemblance to actual people or events is purely purposeful.
Columns
Original: Inside MARKETview: Meet the Data Analysts Dedicated to Your Success · live

Jackson has a bachelor’s degree in mathematics, along with a master’s degree and a Ph.D. in applied mathematics. Her unique academic background informs her work as a MARKETview analyst, not just through her inherent math skills, but also in her rigor for researching and drawing conclusions out of data. Her experience working on her dissertation — predictive modeling of mosquito-borne diseases — synced up nicely with her contributions to MARKETview’s predictive higher ed models. Jackson shared how her experiences working on her Ph.D. prepared her to work with real-time, comparative enrollment data.
“Having to analyze a lot of data for my dissertation prepared me well for joining MARKETview,” Jackson said. “It’s given me the ability to look at the data in new ways and dig through relevant literature to piece together a bigger picture.”
Jackson’s specialized expertise is just one part of the broad range of skills and specializations making up the MARKETview analyst team. She explained how the MARKETview team uses their diverse interests to collaboratively approach the data.
Table
Original: The Changing Landscape of College Search: Building a Proactive Response Plan · live
| 2021 | 2022 | 2023 | |
|---|---|---|---|
| Proportion of Inquiries | 25.5% | 24.0% | 21.2% |
Table in the Regular style, centred, from an old post:
Original: The Covid Class, Part 2: How the 2023 Applicant Pool is Building · live
| Point-in-Time Application Rate Among Search Students | |
| 2020 | 9.4% |
| 2021 | 7.6% |
| 2022 | 8.5% |
| 2023 | 8.7% |
A longer table in the default style (header, 12 rows, footer, caption; sample figures):
| Region | Applications | Deposits | Yield | YoY change |
|---|---|---|---|---|
| Northeast | 48,210 | 11,904 | 24.7% | +1.2pp |
| Mid-Atlantic | 39,875 | 9,412 | 23.6% | +0.4pp |
| Southeast | 61,302 | 13,968 | 22.8% | -0.6pp |
| Midwest | 44,519 | 11,575 | 26.0% | +2.1pp |
| Great Plains | 12,087 | 3,384 | 28.0% | +0.9pp |
| Southwest | 33,640 | 7,064 | 21.0% | -1.4pp |
| Mountain West | 18,233 | 4,376 | 24.0% | +0.3pp |
| Pacific Northwest | 15,908 | 3,659 | 23.0% | -0.2pp |
| California | 57,446 | 11,489 | 20.0% | -1.8pp |
| Texas | 41,770 | 9,606 | 23.0% | +0.7pp |
| International | 9,315 | 1,397 | 15.0% | -2.5pp |
| Unknown / not reported | 2,104 | 442 | 21.0% | +0.1pp |
| Total | 384,409 | 88,276 | 23.0% | +0.2pp |
The same table in the Stripes style, cells sized to their content (no fixed width):
| Region | Applications | Deposits | Yield | YoY change |
|---|---|---|---|---|
| Northeast | 48,210 | 11,904 | 24.7% | +1.2pp |
| Mid-Atlantic | 39,875 | 9,412 | 23.6% | +0.4pp |
| Southeast | 61,302 | 13,968 | 22.8% | -0.6pp |
| Midwest | 44,519 | 11,575 | 26.0% | +2.1pp |
| Great Plains | 12,087 | 3,384 | 28.0% | +0.9pp |
| Southwest | 33,640 | 7,064 | 21.0% | -1.4pp |
| Mountain West | 18,233 | 4,376 | 24.0% | +0.3pp |
| Pacific Northwest | 15,908 | 3,659 | 23.0% | -0.2pp |
| California | 57,446 | 11,489 | 20.0% | -1.8pp |
| Texas | 41,770 | 9,606 | 23.0% | +0.7pp |
| International | 9,315 | 1,397 | 15.0% | -2.5pp |
| Unknown / not reported | 2,104 | 442 | 21.0% | +0.1pp |
| Total | 384,409 | 88,276 | 23.0% | +0.2pp |
Group with a background
The webinar box from an old post:
Original: 5 Key Quotes from Our Presidential Panel · live
Webinar RECORDING
The Disrupted State of Higher Ed: How College Presidents Are Confronting Change
Learn how the presidents from two institutions are addressing and overcoming a variety of disrupting factors across higher education.
Full width, white text, a row that does not wrap (a quote beside a paragraph), from an old post:
Original: The Download on Students From Low-Income Households · live
“MARKETview expands our capacity to be more thoughtful and strategic about new initiatives.”
Dr. Michael Marshall, Vice President for Enrollment, Marketing and Communication, Bellarmine University
Bellarmine University achieved a +63.6% year-over-year increase in enrollment of Pell-eligible students in 2023, marking Bellarmine’s highest percentage on record.
Launched partnership with MARKETview in June 2022
Dark text colour with a HubSpot form embed (HTML block), from an old post:
Original: MARKETview Partners Taking the Stage at NACAC · live
Will you be joining us in Baltimore? Let us know! We’d love to connect with you to discuss your school’s data and how it compares to other schools in the U.S.
Buttons
Buttons with a set width (25%), from an old post:
Original: The Covid Class Part 4: This Cycle’s Deposits · live
Video and audio
Spacer
Text above a spacer (one old post uses one).
Text below the spacer.
Resource box (old plugin block)
The old Resource CTA block (acf/resource, 30 posts), shown as the design’s Inline download box:
Original: How to Exceed Enrollment and Revenue Goals Using a Full-Funnel Data Approach · live
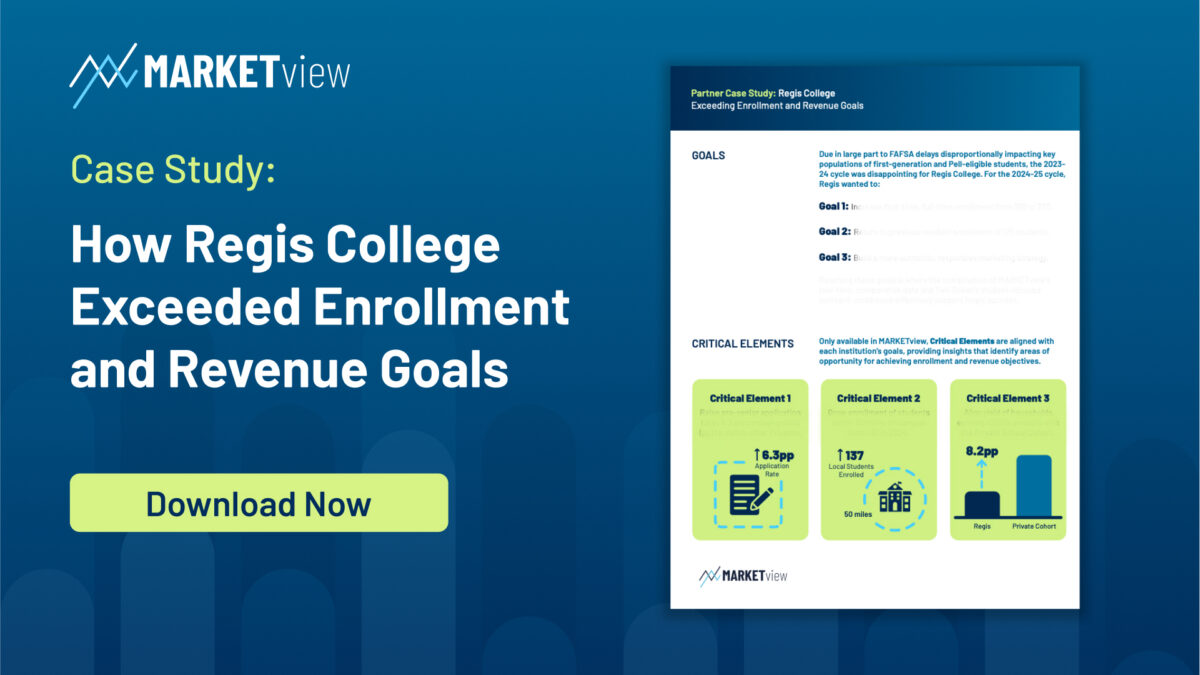
Case Study
How Regis College Exceed Enrollment and Revenue Goals
After a challenging 2024 cycle, Regis College knew they needed to make changes to meet their lofty 2025 goals. In this impactful case study, you’ll discover how the Regis team was able to achieve their enrollment and revenue goals.
Original: Four Steps for Changing Mindsets as a New Leader on Campus · live
eBook
Five Must-Have Tips for Enrollment Leaders at a New Institution
Beginning in a new enrollment leadership role can be daunting — learn how to start your tenure with confidence in this new eBook from MARKETview. We assembled a panel of experts who achieved success in their first year at a new institution and asked them to share their advice for incoming higher ed professionals.

Original: An Inside Look at Direct Admissions Part 2: Best Practices From the Enrollment Professionals · live
Webinar
Direct Admissions: Best Practices from Three Enrollment Leaders
Is Direct Admissions “having a moment” or is increased usage in the past cycle indicative of a growing shift that’s here to stay?
Hear from three enrollment professionals who are also long-term practitioners of Direct Admissions on their perspectives around this barrier-breaking decision type.

Cards (old plugin block)
The old Custom Cards block (acf/cards, 9 posts, one webinar card each), shown as the same box without an image:
Original: Early Insights from MARKETview’s Comparative Aid Report · live
Webinar: The Reinvention of Financial Aid
With this year’s implementation of the “Better FAFSA,” enrollment teams nationwide are wondering when and how to start contingency planning effectively.
This pre-recorded webinar provides exclusive insight and tips on how to prepare for these upcoming financial aid changes with confidence.
Icons (old plugin block)
The old Icons block (acf/icons, 1 post), shown as a box with the items in columns:
Original: How Innovative Thinking Led to Extraordinary Enrollment Success · live

Goal #1

Goal #2

Goal #3
Accordion (old plugin block)
The old Getwid accordion (6 quiz posts), shown as the design’s FAQ accordion:
Original: The Real-Time Data Quiz: June ’24 Edition · live
Q1
Category: Residency
Compared to last year, which residency status experienced the smallest change in yield rate?
A) In-State
B) Out-of-State
C) International
While all three groups closed the gap strongly in the final weeks, it was the Out-of-State population that experienced the least volatility with a yield change of -0.8 percentage points (pp) from the previous year. In-State saw the greatest amount of change at -1.7pp and International filled the middle slot at -1.1pp.
The decline within the In-State cohort is especially disappointing given that many schools depend on this population as a key audience to meet their goals.
Q2
Category: Inquiry Timing
What was the year-over-year change in yield rate for students who were in the inquiry pool prior to the start of their senior year in high school?
A) -0.7pp
B) -1.4pp
C) -2.1pp
Traditionally, pre-senior inquiries are a dependable population, given the increased interaction they’ve had with specific institutions, thus developing a stronger affinity. That was not the case in this odd yield cycle, however, as pre-senior inquiries were off -1.4pp from 2023.
For context, students who first inquired as seniors (normally, a far less dependable population) were only off -1.1pp. Not the best outcome, but quite surprising when compared to long-standing funnel metrics.
Q3
Category: Consumer Income
Which income band showed the largest yield-rate deficit versus the previous cycle?
A) <$50k
B) $50k – $100k
C) $100k – $150k
D) $150k – $200k
E) $200k – $250k
F) $250k+
The early hypothesis was that deposit numbers from students in low-income households would be most adversely affected by the delayed FAFSA, but the opposite happened. While yield rate decreased across all consumer deciles, the $250k+ cohort declined the sharpest at -1.3pp.
Here’s where the other income bands landed:
<$50k: -1.0pp
$50k – $100k: -1.0pp
$100k – $150k: -1.2pp
$150k – $200k: -1.0pp
$200k – $250k: -1.1pp
Article parts (new)

Key takeaways
- Key takeaways: a green box with ticks.
- Insert it from the patterns.
- Each item is one sentence.
Bar chart
Five bars in the four tones plus Critical.
Free report
Get the full report
One line on what is inside.
Newsletter
Get the next one in your inbox.
The last paragraph of the body, before the tags.